
SunGlow Innovations
Science
How local oxidative reactions, image guidance and containment come together in the CDX-101 research program.
CDX-101 MECHANISM RESEARCH
Local oxidation and secondary ischemia
- 1Experimental observation
Direct contact
Tissue changes were documented at the site of contact in laboratory experiments. The sponsor attributes this local effect to oxidation.
- 2Observation and hypothesis
Microvessel at the contact zone
Vascular injury was observed in an animal model. The sponsor hypothesizes that injury to tumor microvessels can reduce flow beyond the contact zone.
- 3Hypothesis
Downstream ischemia
Reduced perfusion could contribute to tissue injury outside the direct contact zone. The proposed study treats perfusion measures as exploratory.
Schematic. The red vessels show the proposed path from local contact to a downstream perfusion change. The figure contains no clinical imaging or perfusion measurements.
12 technical features
The features follow Table 2-1 of the IND Investigator’s Brochure and Table 4-1 of the technical rationale. Expand each item to see how the observations support it and to read the related studies and case records.
01Two local effectsObservation and hypothesis
The sponsor proposes direct oxidation in tissue exposed to the solution and a second effect mediated by the tumor microvasculature.
- What was recorded
- Laboratory tissue changes and vascular injury were reported. In selected human and animal cases, the estimated extent of necrosis exceeded the delivered liquid volume.
- How the evidence supports this feature
- The liver experiments document a local contact effect, and the mouse vascular model shows that injury after vascular exposure can involve downstream tissue. In canine mammary tumor case P19, the visible contact zone on day 2 was smaller than the main lesion, which separated as a whole on day 9. These observations motivate testing the secondary ischemia hypothesis by comparing distribution, perfusion and later necrosis within the same lesion.
- Next assessment focus
- Compare contact distribution, perfusion change and necrosis in the same lesion to assess the contribution of downstream ischemia.
02Rapid self-limitation and a stable reaction boundaryExperimental observation
The sponsor links rapid consumption at the contact site to a bounded reaction.
- What was recorded
- In the whole-blood experiment, a reaction boundary was described at about one minute with no visible expansion at 60 minutes. Ex vivo liver experiments also showed a bounded reaction.
- How the evidence supports this feature
- Whole blood developed a visible reaction boundary in about a minute, and the recorded zone remained stable during observation. Fresh and freeze-thawed liver also showed similar, sharply bounded zones. The agreement across these preparations supports a rapid transition to a stable local reaction under the tested conditions. The clinical plan evaluates distribution and blood reaction products separately.
- Next assessment focus
- Use the experimental reaction boundary as a starting point and assess distribution and exposure in participants with real-time imaging and blood tests.
03Short intravascular propagationExperimental observation
The original materials describe a localized pattern of injury following vascular exposure in an animal model.
- What was recorded
- In the mouse tail-vein model, injury was described around the accessed vessel and its downstream territory.
- How the evidence supports this feature
- The mouse tail-vein observations localized visible injury to the exposed vascular region and adjacent downstream tissue. They support a spatially bounded pattern in that model and document why non-target exposure matters. The study tracks visible spread beyond the lesion and subsequent tissue injury as separate safety observations.
- Next assessment focus
- Use delivery imaging, out-of-lesion distribution records and safety follow-up to assess non-target tissue injury.
04Hemostasis and acute edema observationsHistorical observation
The original tables pair reports of bleeding cessation with observations on early swelling.
- What was recorded
- Selected historical reports described bleeding cessation or no visible early swelling during limited observation.
- How the evidence supports this feature
- Bleeding stopped at the treated site in human breast tumor case H1 and in feline squamous cell carcinoma case P10. Canine case P6 separately recorded no swelling on day 1. These case records support tracking hemostasis and early swelling as distinct local outcomes, with the time of onset and duration recorded for each.
- Next assessment focus
- Record bleeding, swelling and pain at standard time points to quantify the magnitude and duration of symptom changes.
05Intraprocedural visual changesHistorical observation
Directly visible lesions provided an early visual readout in the historical records.
- What was recorded
- In a four-dog oral and tongue tumor image series, surface changes were documented about 15–20 minutes after delivery.
- How the evidence supports this feature
- The canine oral and tongue tumor series captured visible surface changes during the procedure. Surgical observation in P18 also recorded persistent discoloration in the exposed area. Their timing makes surface appearance a useful procedural observation in lesions that can be seen directly. Follow-up imaging provides a separate assessment of tissue viability.
- Next assessment focus
- Compare visible surface changes with perfusion imaging and the later assessment of tissue viability.
06Real-time distribution imaging and containmentHistorical observation
Imaging was used to observe the visible distribution front and its relationship to the lesion boundary.
- What was recorded
- The historical material reports a visible ultrasound front in about 1–2 seconds and bounded contrast-enhanced CT distributions in selected cases.
- How the evidence supports this feature
- Historical ultrasound records captured a visible front as distribution occurred. In P12, CT showed the distribution and identified an area without visible coverage. Together these observations support monitoring where the solution is visible relative to the lesion boundary during the procedure. Follow-up contrast imaging answers the separate question of how much tissue became non-viable.
- Next assessment focus
- Record visible distribution during delivery and necrosis on follow-up separately, then compare the two measures.
07Local effects after repeat sessionsHistorical observation
The sponsor describes repeat local effects in residual or recurrent lesions.
- What was recorded
- Selected human and companion-animal records reported further local changes after subsequent sessions.
- How the evidence supports this feature
- In canine oral sarcoma case P4, local changes were recorded after both sessions. Case P15 also recorded necrosis during a course of three sessions in one month, with fever documented after the first session. Session-by-session records support evaluating whether the local effect recurs and tracking adverse events across the course.
- Next assessment focus
- Compare local response and adverse events across early and later sessions to assess repeatability and cumulative safety.
08Large or irregular lesionsHistorical observation
The sponsor describes assessing different regions of complex lesions separately or across sessions.
- What was recorded
- The historical series includes selected cases involving large lesions in humans and companion animals.
- How the evidence supports this feature
- CT showed several distinct distribution zones in canine soft-tissue sarcoma case P6, and the mass later collapsed markedly. In the large chest-wall mass P7, the contour changed and the record showed no measurable shrinkage at day 12. The different findings support assessing coverage and subsequent response by region, with lesion size and anatomy documented alongside the findings.
- Next assessment focus
- Record coverage, local response and safety by lesion size and anatomical location to define the range of application.
09Multiple lesionsHistorical observation
The source distinguishes assessment of individual lesions, groups of lesions and staged sessions.
- What was recorded
- Selected companion-animal records document multiple lesions evaluated during one session or across a course.
- How the evidence supports this feature
- Ultrasound-guided delivery was recorded in several larger masses in canine multicentric lymphoma case P20. In human breast cancer case H10, two treated sites had a documented local response and follow-up, with new nodes recorded outside the treated field. The records support the feasibility of working with more than one lesion and show the value of tracking treated and untreated sites separately.
- Next assessment focus
- Record the number of lesions and aggregate exposure per session to assess the feasibility and safety of treating multiple lesions.
10Early symptom changesHistorical observation
The sponsor reports early changes in selected symptoms and functions.
- What was recorded
- Historical records describe changes such as reduced bleeding, less pain, or improvement in a local function.
- How the evidence supports this feature
- Human case H1 documented reduced pain after local bleeding stopped, while case H5 recorded changes in breathing, pain, sleep and appetite. In canine oral sarcoma case P4, the record also tracked eating and activity. These observations identify specific symptoms and functions worth measuring from baseline through follow-up alongside imaging findings.
- Next assessment focus
- Track pain, bleeding, eating and breathing at standard follow-up points to assess the size and duration of symptom changes.
11Experience across operatorsProcedural record
The original tables present reproducibility across operators as a research feature.
- What was recorded
- Cases were recorded at different institutions by operators with varying prior experience.
- How the evidence supports this feature
- The procedural records document use by operators at different institutions. The study protocol provides a common framework for recording visible distribution and for reviewing follow-up images. Together they support a practical approach to comparing consistency across teams using the same observations and review criteria.
- Next assessment focus
- Compare how consistently teams carry out the procedure under a common training and imaging workflow.
12Use of standard delivery instrumentsProcedural record
The original tables describe standard needles and syringes for the delivery step.
- What was recorded
- Historical procedural records document standard delivery instruments.
- How the evidence supports this feature
- The procedural records describe delivery using standard needles and syringes. The study pairs those instruments with imaging or direct visualization appropriate to the lesion, and specifies containment and safety assessments. The records support use of standard instruments for the delivery step, with the study workflow defining how teams evaluate that step.
- Next assessment focus
- Use standardized procedure records and imaging review to assess how consistently teams can carry out the study workflow.
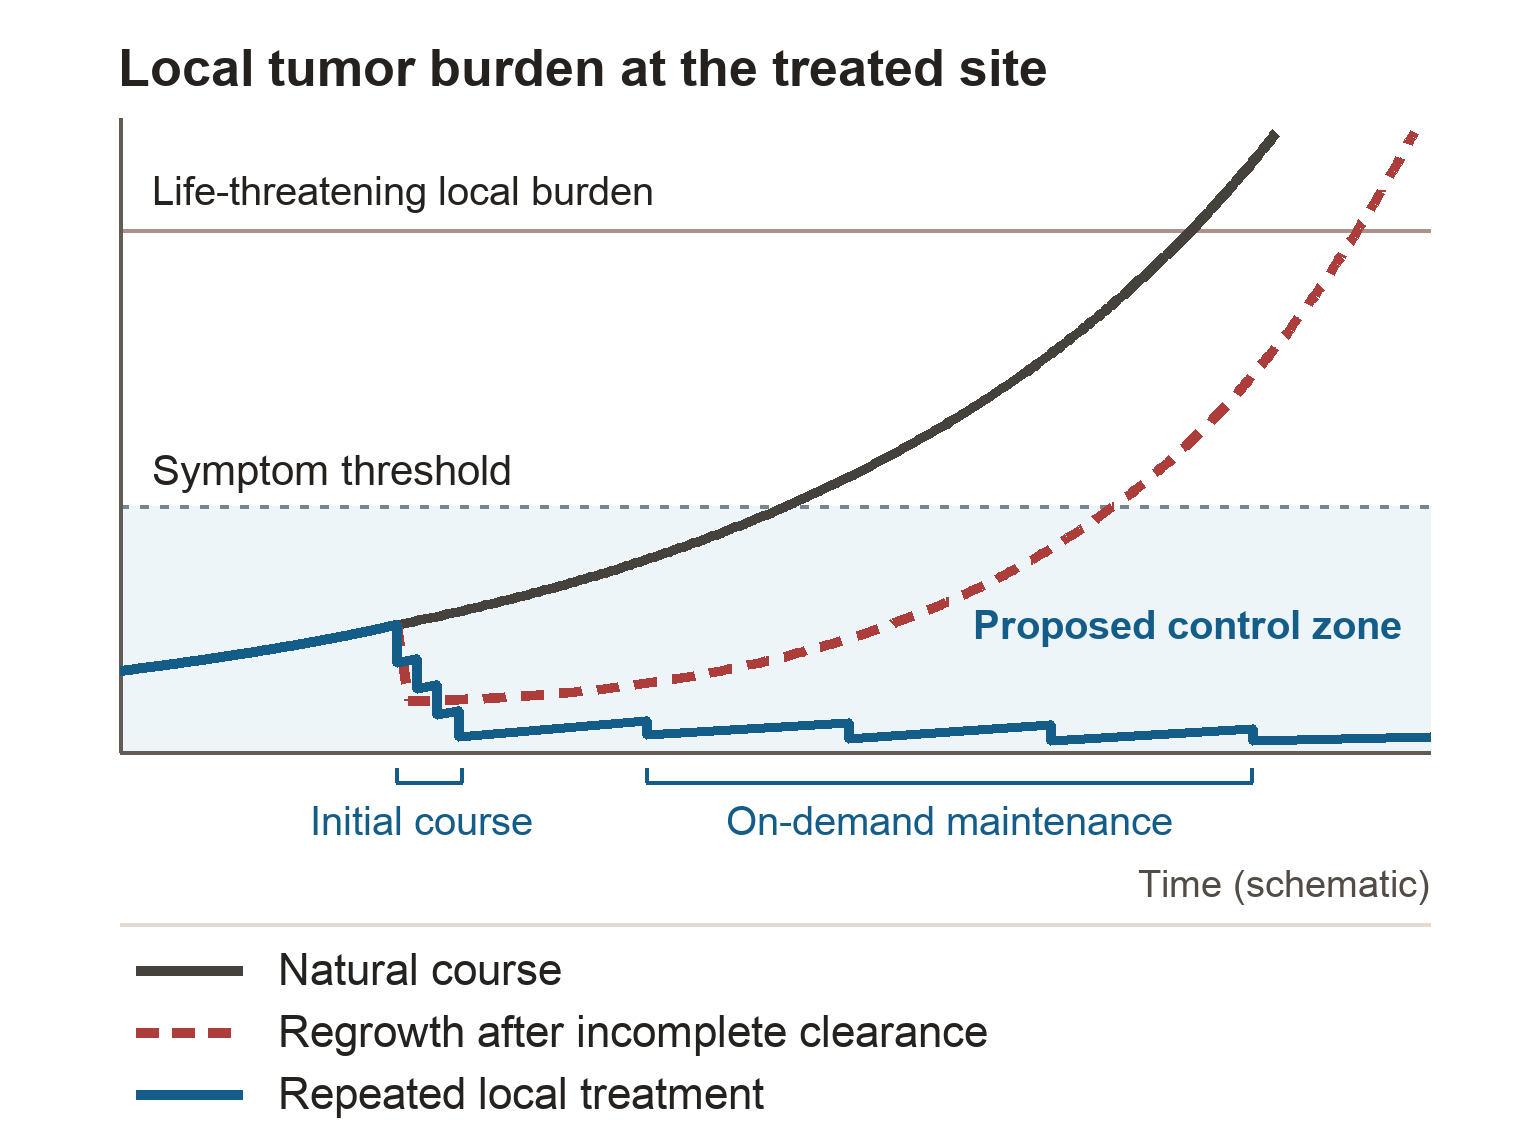
LONG-TERM RESEARCH HYPOTHESIS
How we aim to make some cancers manageable as chronic diseases
-
Limit exposure to the target
The sharp reaction boundaries recorded in experiments provide the basis for testing image-guided containment in patients.
-
Build on local tumor control
Local tissue changes have been recorded in the treated area. Follow-up imaging assesses tissue viability and helps evaluate the proposed role of microvascular effects.
-
Manage new or residual lesions over time
Repeat local treatment could allow accessible residual or new lesions to be managed over time, alongside other treatments when appropriate.
-
Make long-term cancer control possible
The long-term goal is to sustain control of lesions and symptoms, reduce the threat cancer poses to life and help some patients live longer with manageable disease.
Technical features 10
This is the program’s long-term development hypothesis. CDX-101 remains investigational. See the Phase 1 endpoints
Local oxidative action and thermal ablation
Investigational CDX-101 uses a local chemical oxidation mechanism. Thermal ablation modalities use tissue temperature change. This distinction concerns the mechanism. The project sources do not establish superior safety or efficacy versus thermal ablation.
IB v1.0 §2.4, mechanism and procedure comparisonPHASE 1 STUDY DESIGN
How delivery is studied and what Phase 1 measures
The proposed research uses imaging to locate the target lesion and confirm that the needle tip is within it. The study evaluates local delivery of the golden-yellow chlorine dioxide solution and monitors the visible distribution relative to the lesion boundary. The protocol also allows direct visualization for appropriately exposed lesions.
- Primary · Safety and containment
- Assess tolerability, dose-limiting toxicity and other adverse events. Record imaging-visible spread outside the lesion, deliveries stopped for safety and any injury to non-target tissue.
- Secondary · Local response
- Assess complete non-viable response (CNVR) on follow-up imaging, along with the extent of necrosis and the duration of local control.
- Exploratory · Perfusion
- Study changes in blood flow in the treated area. These measurements help investigate the secondary-ischemia hypothesis.
Visible distribution during delivery measures containment. Follow-up imaging evaluates whether tissue later became non-viable.